10 Free Online Tools to Improve Your Workflow and Presentations
1As a designer or freelancer you might have to attend different presentations, show results, pre-planning processes, ideas and so on, which might be difficult for some of us, because we are simply not interested in workflow tools and because we never had to care about those – we know how to design or develop, why should we know how to present ideas?

Well, in my opinion presenting your ideas in a clean, high-quality state is important and it will only do good for your reputation and chances of getting a job. Therefore today I will share a list of free online tools that can help you present your ideas in a really nice, original and clean way.
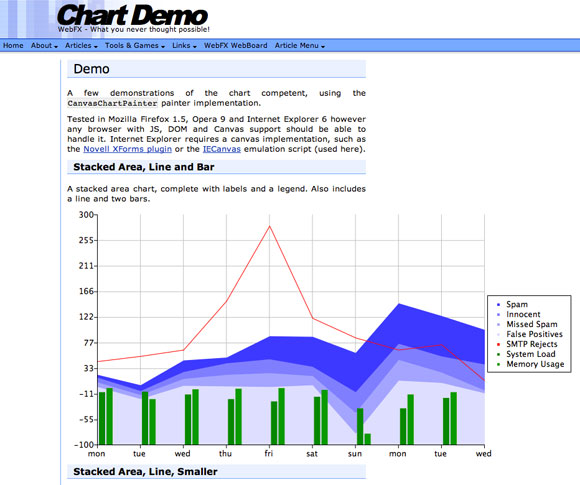
ChartDemo is very good if you want to create a stacked area chart, also featuring complete labels and legends. Sure, this can also be done in PowerPoint, but don’t forget ChartDemo is a free tool.
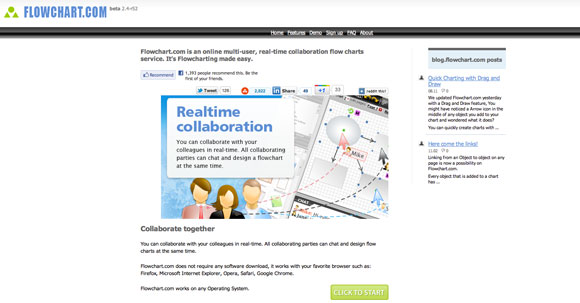
FlowChart is not very different from ChartDemo, but its advantage is that it allows you to create charts and diagrams which you can modify and see together with your colleagues. You don’t need to download any software, nor do the ones you want to share your flowcharts with.
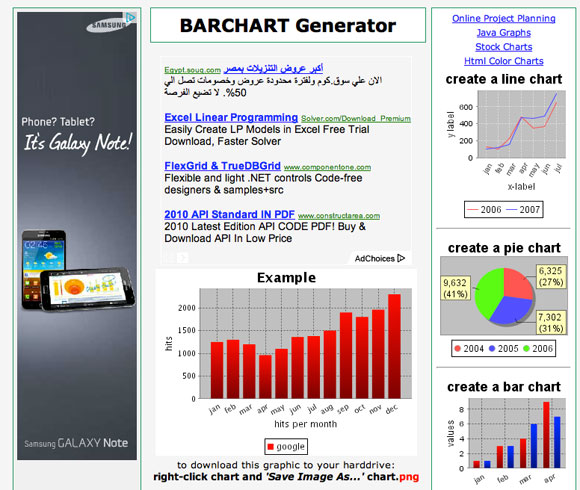
As the name suggests, BarChart is a free tool for creating bar graphs. It doesn’t do more than that, but you have lots of options to customize your charts and if you only need bar graphs, then you will not need other tools.
Bubbl is another interesting tool with many customizing options. It allows you to create online mind maps and color each one of them with another color, if you wish to. Another interesting option is the embedding tool. With it you can embed your mind maps in blogs, webpages or forums and you can even e-mail it if you need to.
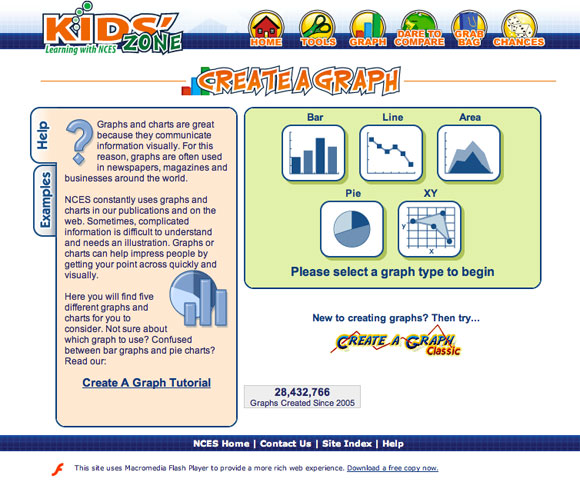
The clear advantage of CreateAGraph is the fact that if you need more types of graphs, you can create all of them with this tool. You don’t need five others to make graphs, but only use the types this has: bar, line, area, pie or XY.
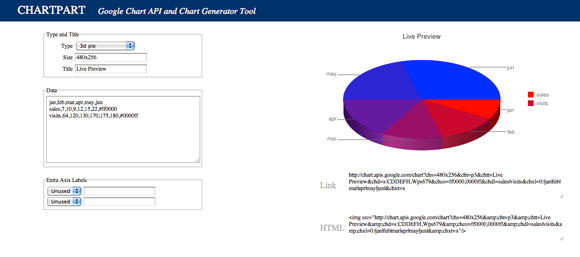
ChartPart is very useful if you need pie graphs with legend and labels.
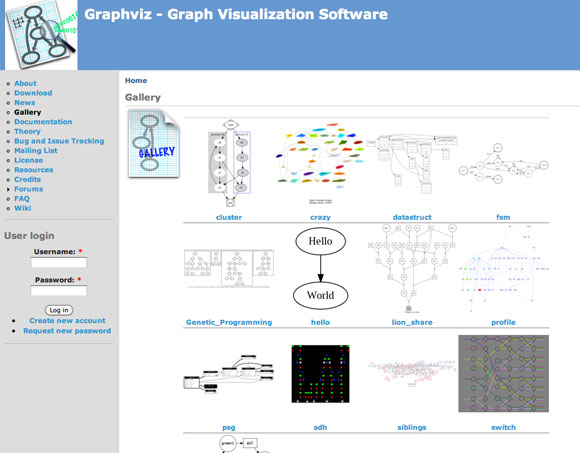
Gaphvizis an incredible online tool that right now I think it is quite unique on the market. It is an open source graph visualization software featuring important applications in networking, bioinformatics, software engineering, database and webdesign, machine learning and in visual interfaces for other technical domains. It has a simple layout, it is very easy to use and makes diagrams in useful formats. For example you can export a graph into an SVG, PDF or Postscript for embedding in other documents.
There are many customizing options for the graphs, such as line styles, hyperlinks, Rolland custom shapes, fonts, colors or tabular node layouts.
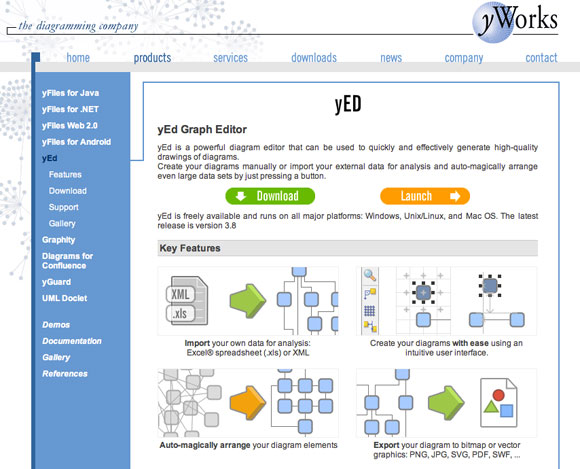
This online tool is a powerful diagram editor which can be used to generate high-quality drawings of diagrams. It allows you to create your diagrams manually and even import data for analysis and it arranges large data sets automatically at the press of only a button.
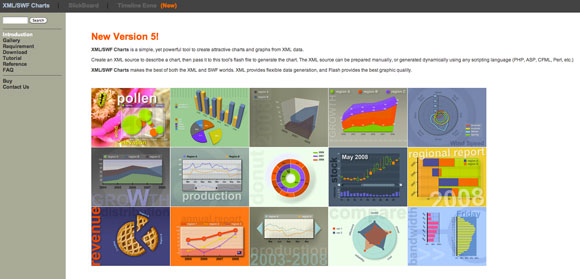
This is another quite unique tool that can be easily found on the internet. Its main feature is that it allows you to create graphs and charts from XML data. Another interesting feature is that it can generate data dynamically using many scripting languages, such as PHP, CFML, Perl, ASP and others. The tool focuses a lot on graphics and the charts generated with this tool will always look good and make a good impression on the ones watching them.
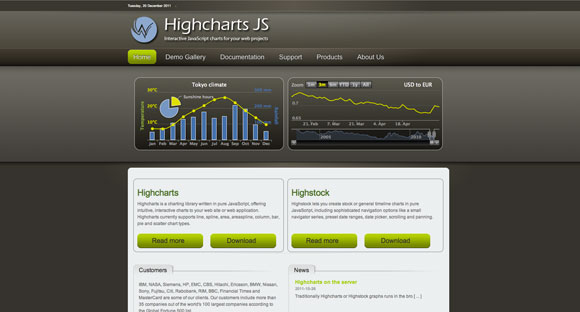
Highcharts is a tool powered by a JavaScript library and generates many types of graphs, such as line, spline, area, areaspline, bar, scatter charts, pie or column. With Highcharts it is very easy to create graphs and workflows, and it allows you to easily add them to a website or a web application.
This was the list of recommended free online tools you might want to try if you make presentations often. They do not only provide interesting features, but work fast, well, can be embedded and are free. Sure, all those things can be generated with PowerPoint, but don’t forget that Microsoft’s Office suite is quite expensive and not everybody is willing to pay for it only for some pie charts.
If you make presentations it might be a good idea to give a try to these incredible 10 tools, you might be surprised what they can do for you.


Great tools thanks!
Here is another cool presentation tool that allows you to create animated presentations:
http://www.powtoon.com