Useful and Creative Examples of Infographics
1Visualizing data is one of the most efficient means of delivering rough numbers and statistics in a creative and interesting way.

Infographics is concerned with providing visual illustration for information and studies in the form of charts and elements. These charts help deliver the information to the audience fast and more easily compared to other methods of delivering ideas.
While infographics does not follow a specific design form or rules, such as charts, it needs to be usable and easy to understand. This challenge requires the infographics designer to understand the data flow and links between different pieces of information. In this showcase, you will find some useful and creative examples of infographics with different styles and creative approaches. I hope you will like these examples and find them useful, and do not forget to check the following infographics related posts:
- Creative Infographics to Visualize Information
- Introduction to Infographic Design
- Amazing Examples of Infographics to Visualize Your ideas
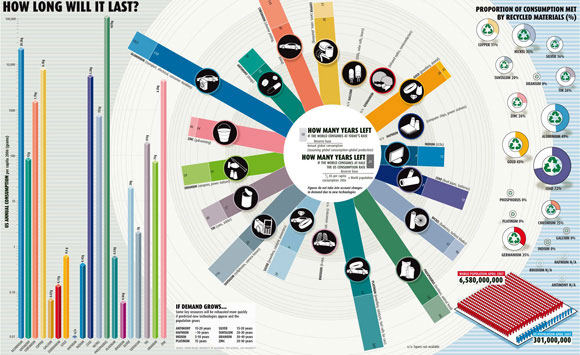
How Long Will It Last?
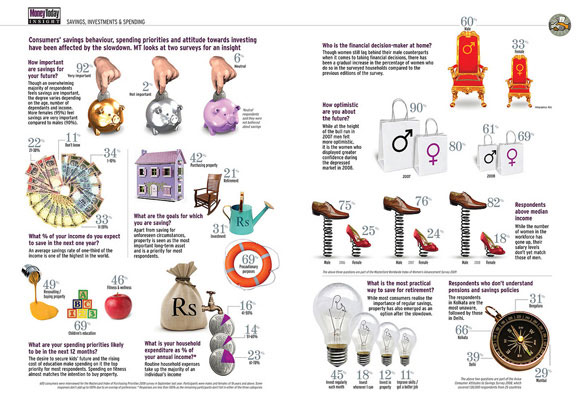
Consumer Saving Behaviour
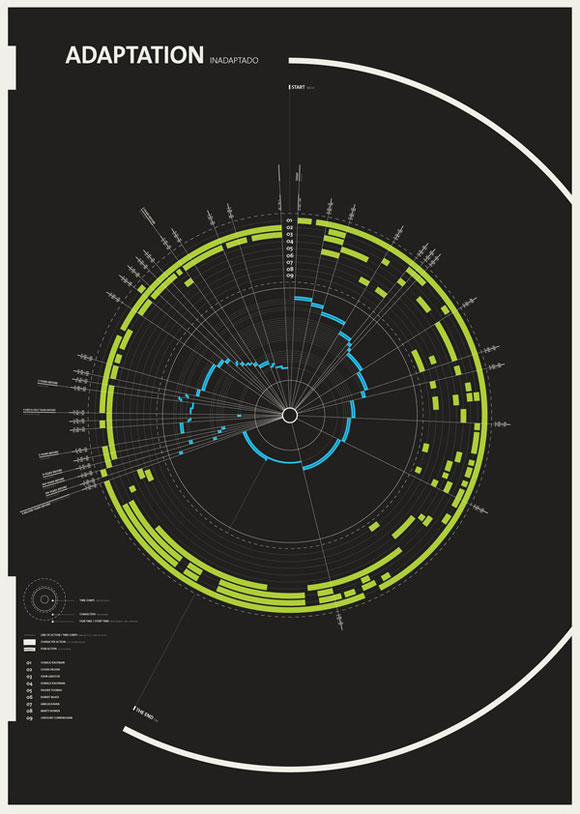
Adaptation Infographic
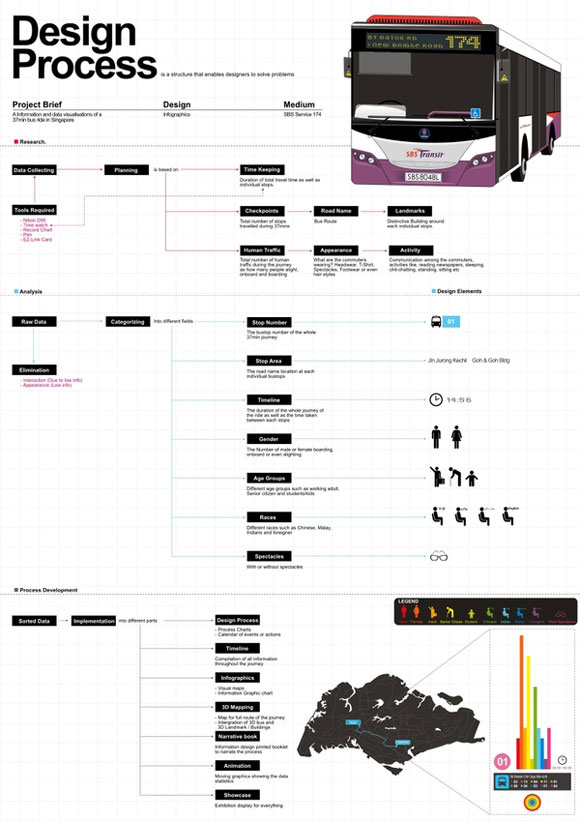
Design Process
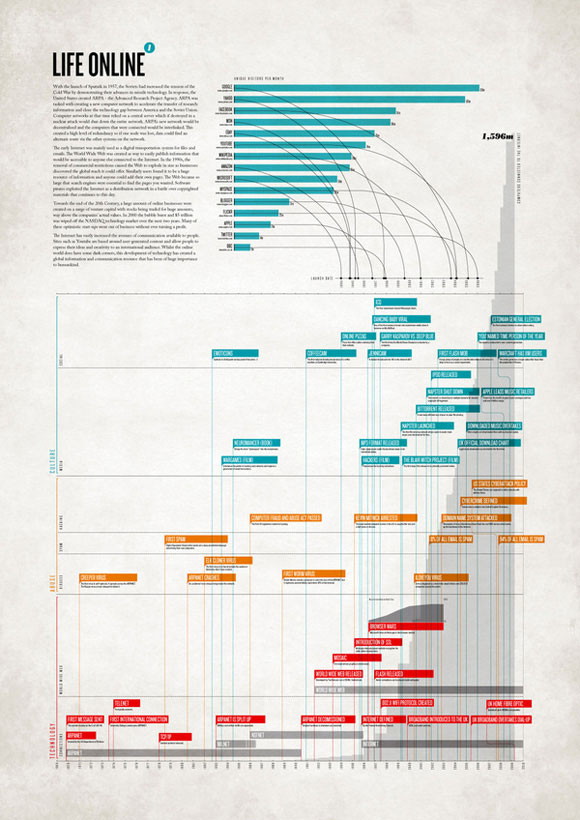
Digital Nostalgia
A set of information graphics which examine the technological changes in our lifetimes and the influences they have had on our lives.
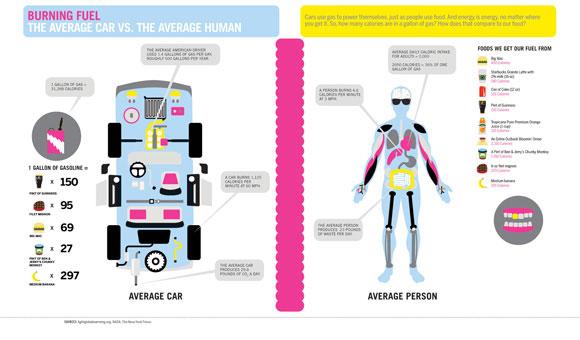
Burning Fuel
The average car vs. the average human fuel consumption
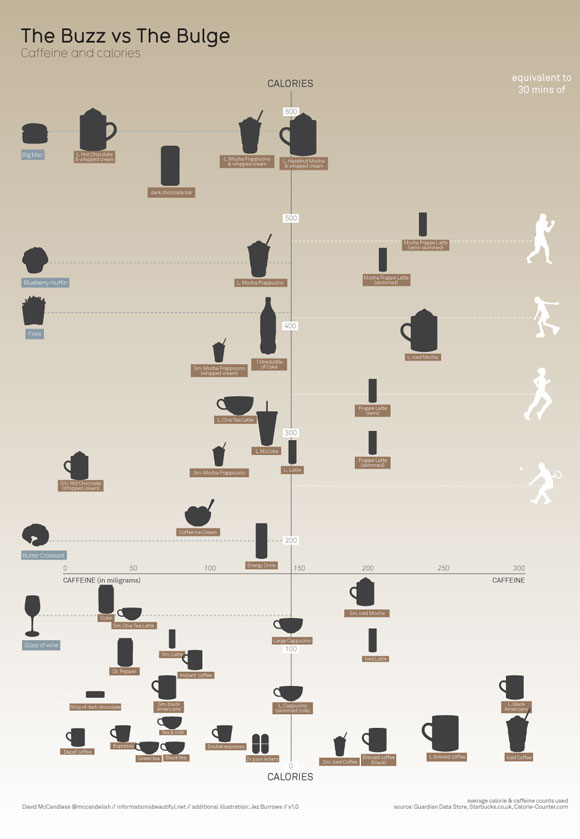
Caffeine and Calories Infographic
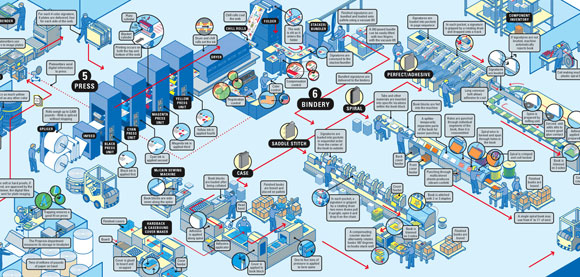
Information Design
Infographic shows how a product is made.
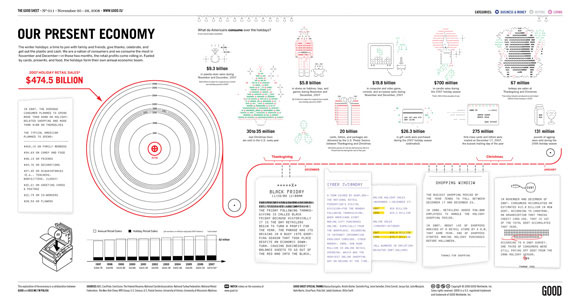
Our Present Economy
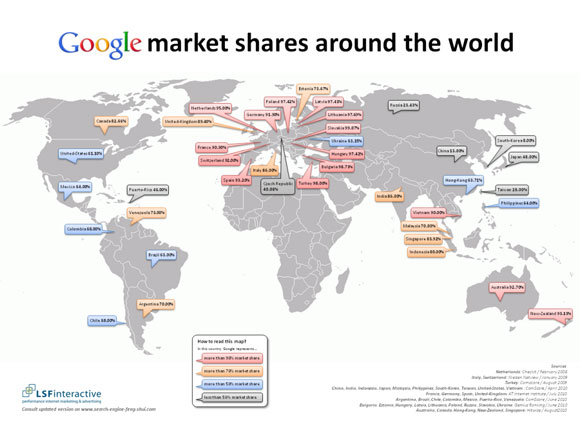
Google market shares around the globe
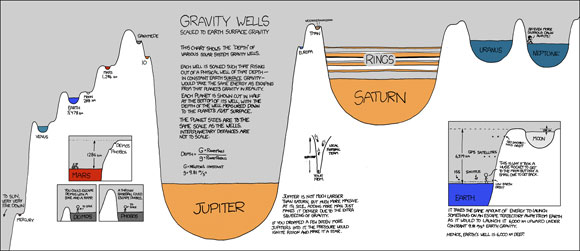
Gravity Wells Infographic
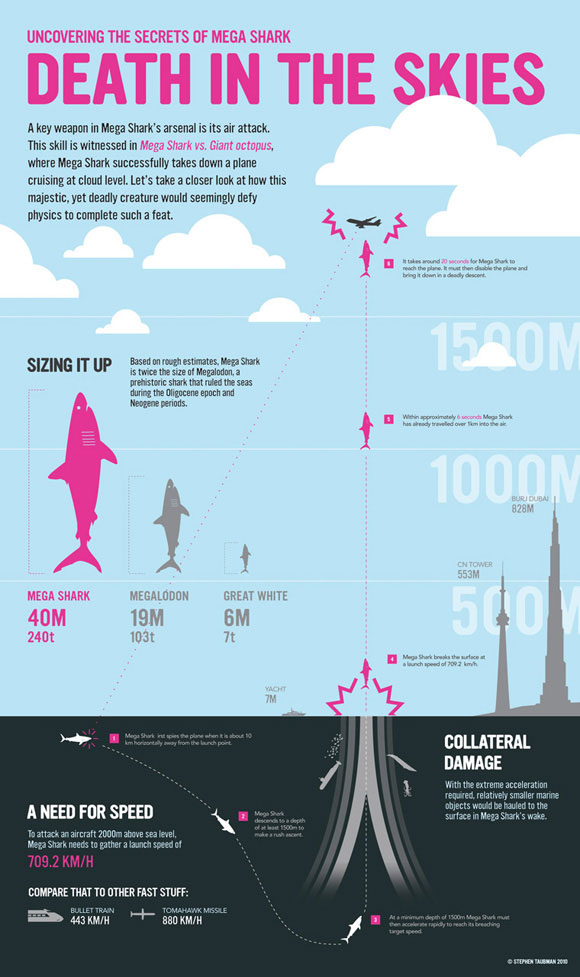
Infographic: Mega Shark
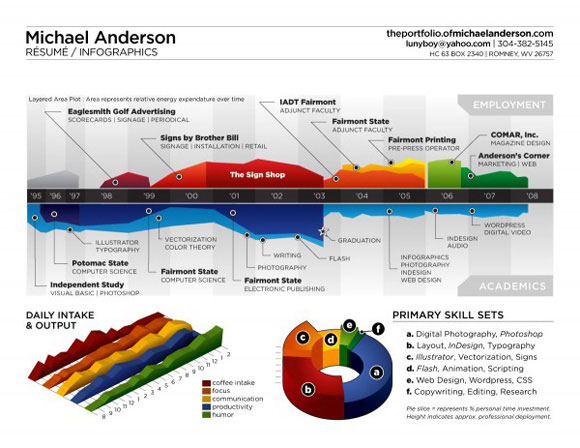
Michael Anderson’s resume is an infographic
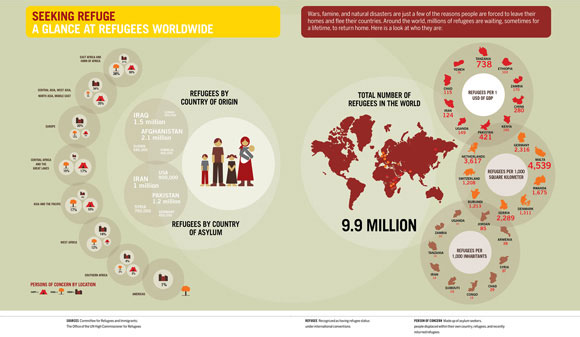
Seeking Refuge Infographic
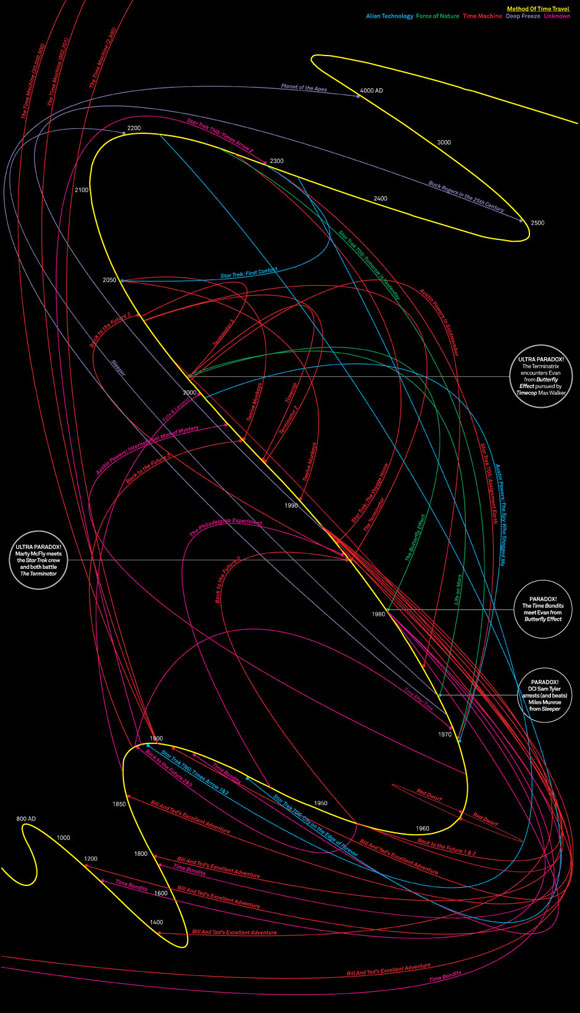
Timelines Infographic
Time travel in popular films and TV
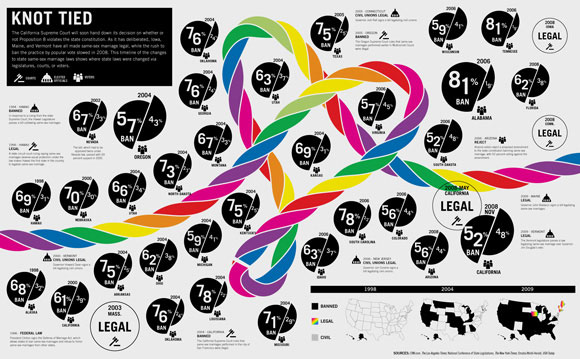
Transparency Infographic
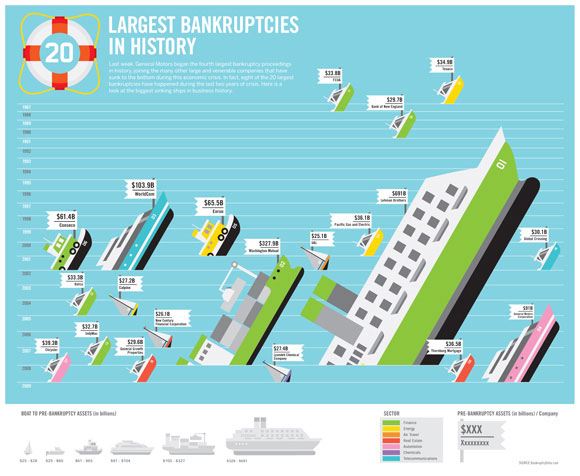
Transparency: The Largest Bankruptcies in History
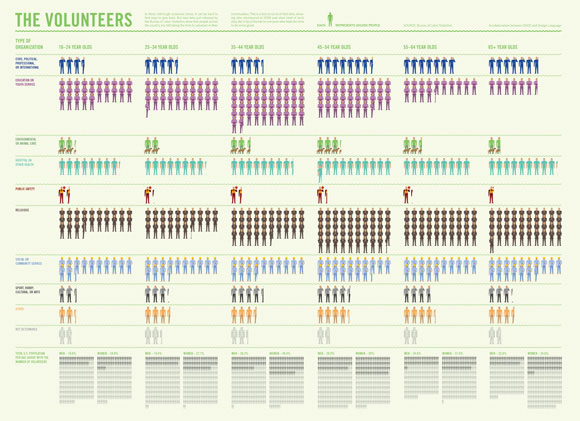
The Volunteers Infographic
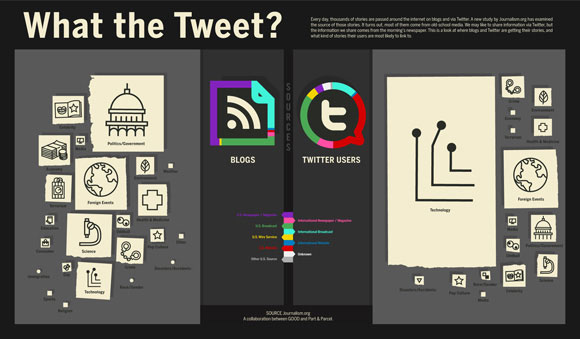
What the Tweet Infographic
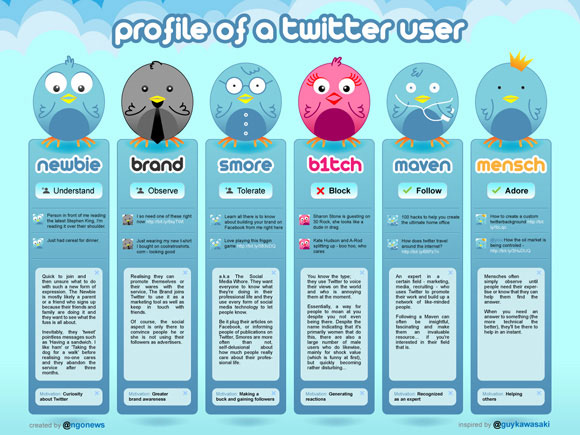
Twitter Users Profile Infographic



Every one of the infographics you have listed actually can take at least 5 mins to analyze and get the required info. Such excellent examples indeed. My favorite is Information Design. It is for engineer pragmatic types like me. 🙂