Creative Infographics to Visualize Information
4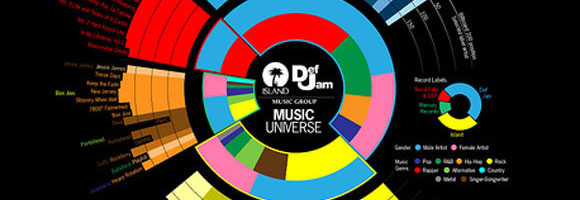
Reports and analyzing summarizes are not interesting for many people, especially when many Internet users need to get the information rapidly. However, the visualized information are more suitable for the internet users than the text reports. Also, it helps remembering information through the visual memory for further reference.
Infographics use the visual elements to deliver the information in an interesting way and easy to understand charts. Each infographic design changes based on the type of information and the best way to deliver it. The amount of information plays a critical rule in displaying the information because the graphic elements used in the infographic charts should help displaying the information and not distract it. The following examples show infographic charts; either made manually or by infographic maker online tool; with different designs and styles that are used to display different information.
If you like this type of visual information, you may like to check the following article:
Introduction to Infographic Design
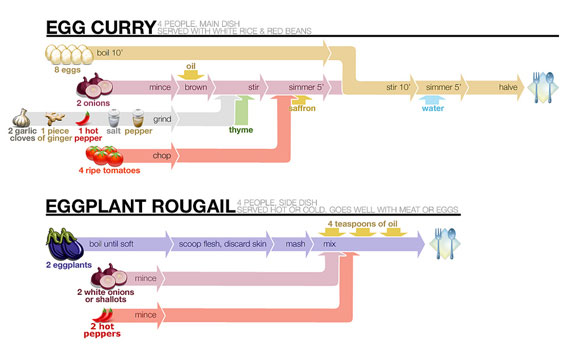
How recipes should look
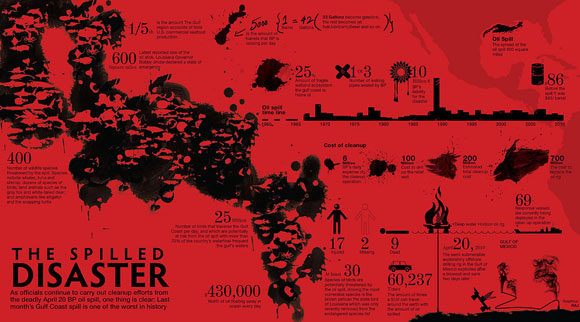
The Spilled Disasters
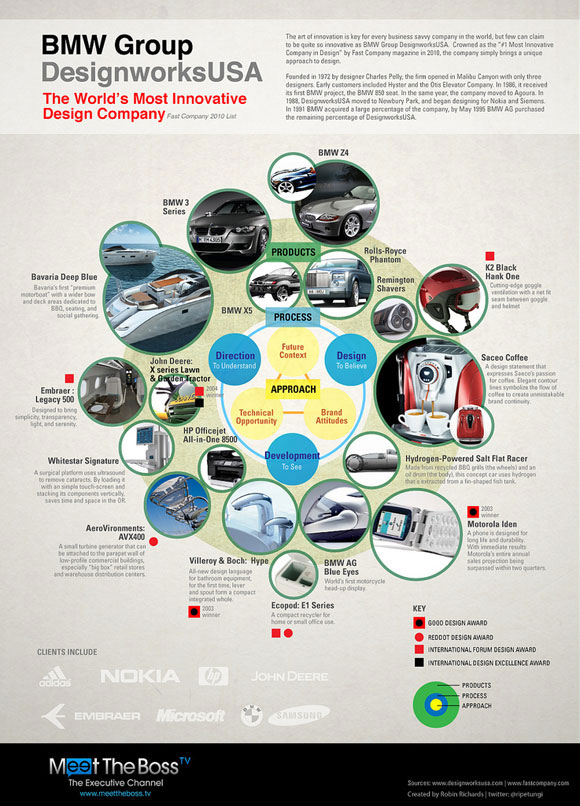
BMW Designworks
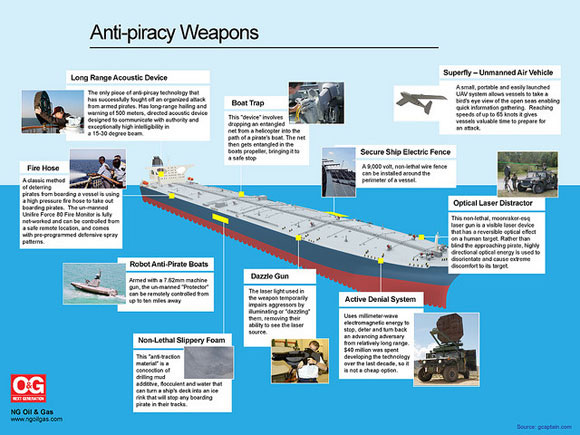
Preventing a Pirate Attack
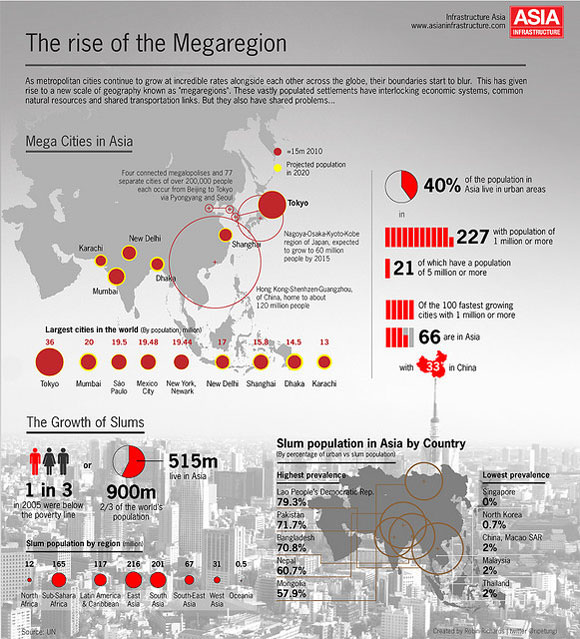
ASIA Mega Regions
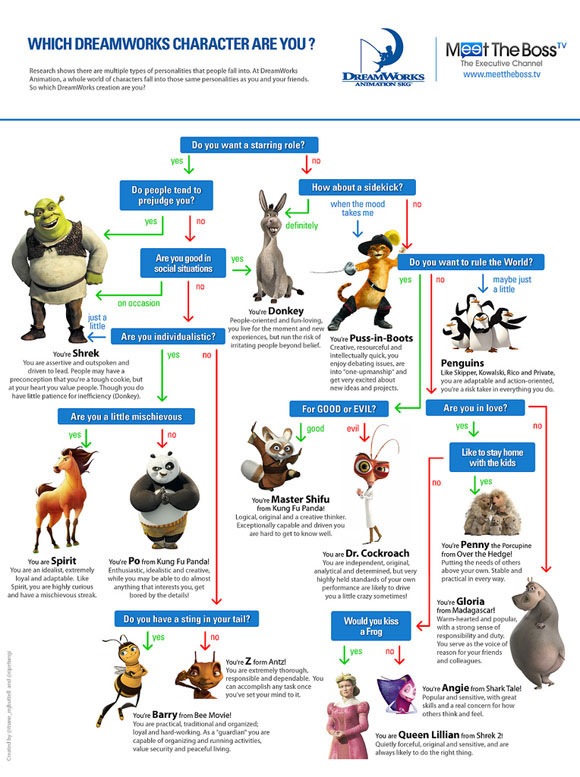
Which Dreamworks Characters Are You?
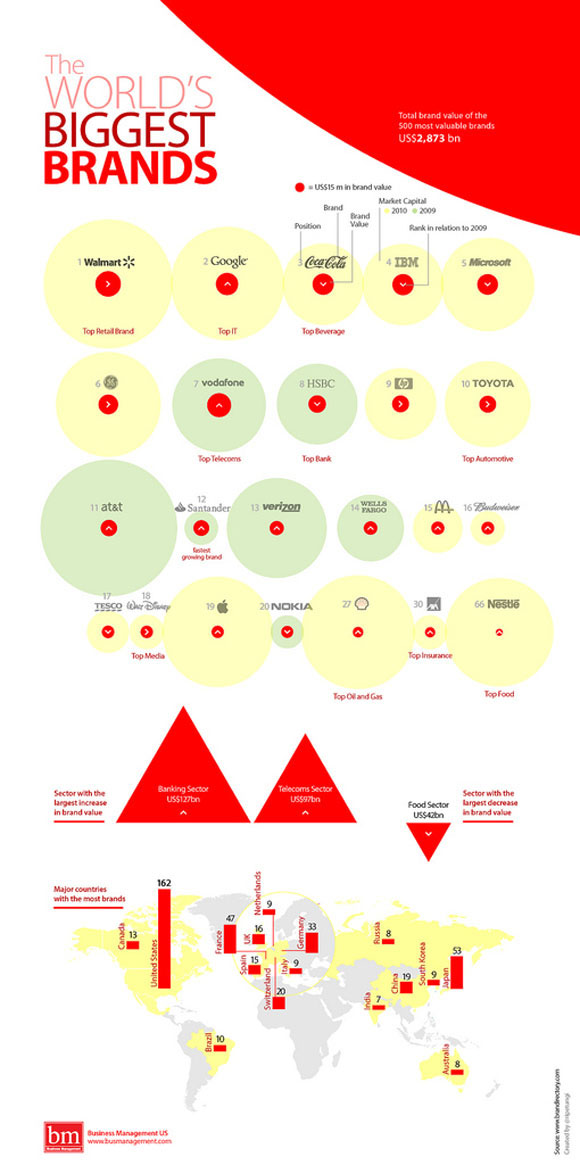
Worlds Biggest Brands
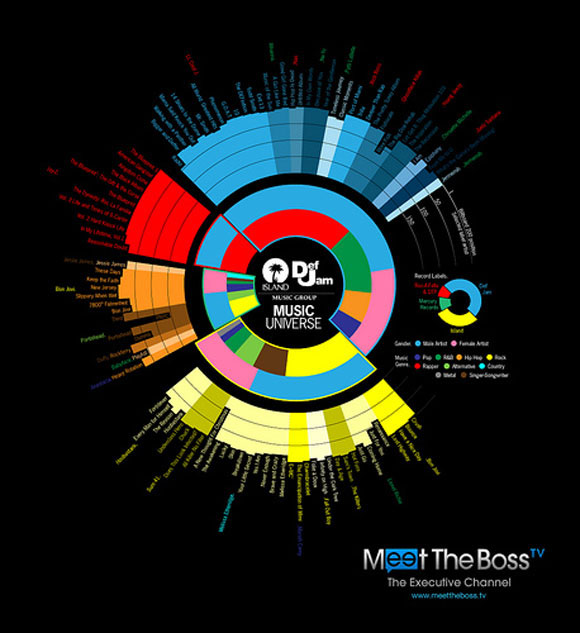
Def Jam Records Discography
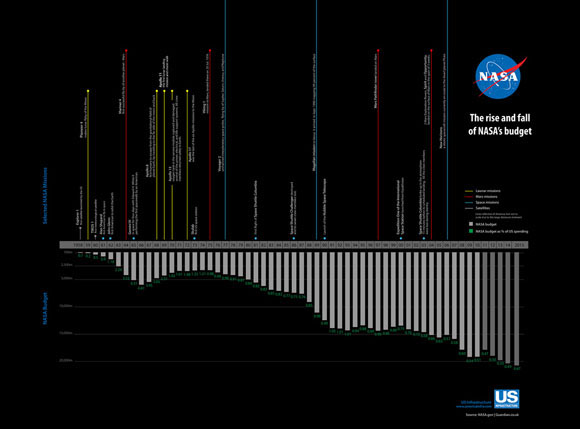
Rise and Fall of NASA’s budget
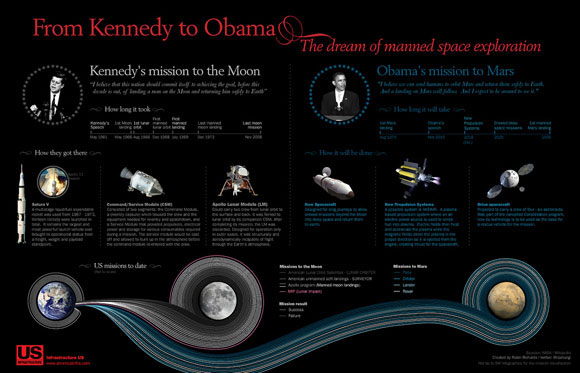
Mars Mission
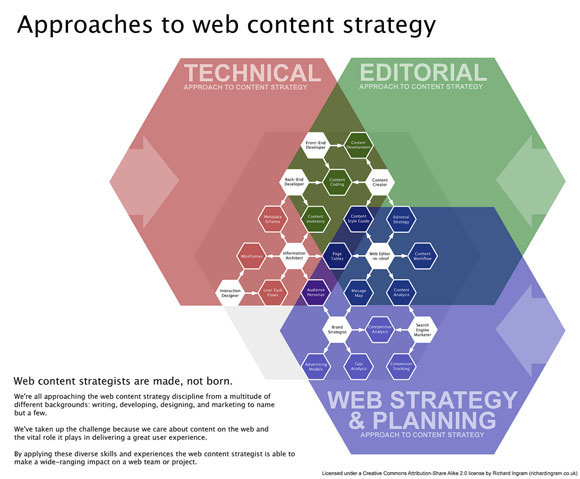
Approaches to web content strategy
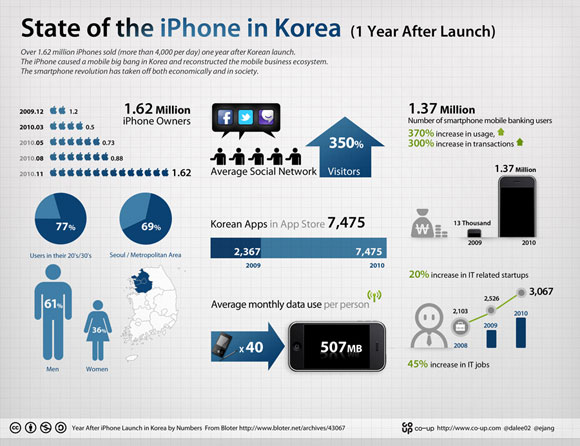
State of the iPhone in Korea (1 Year After Launch)
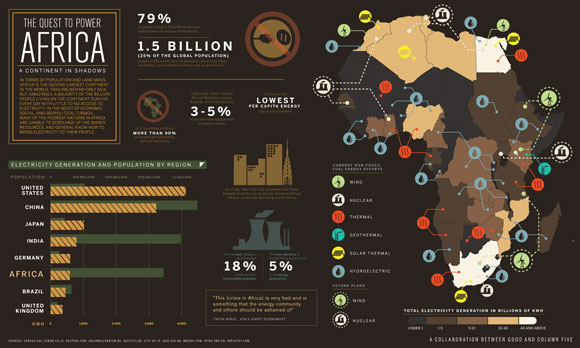
Africa Energy
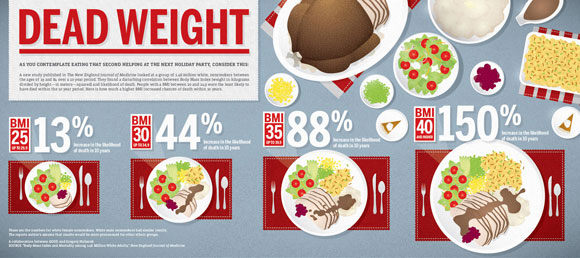
Dead Weight
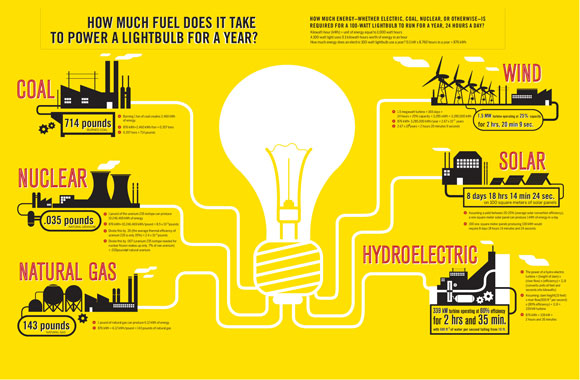
How Much Fuel Does It Take to Power a Lightbulb for a Year
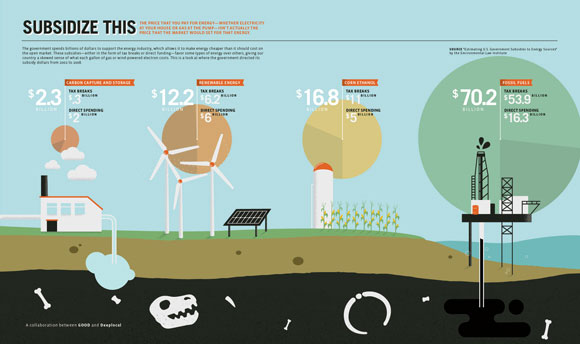
The Price That You Pay for Energy
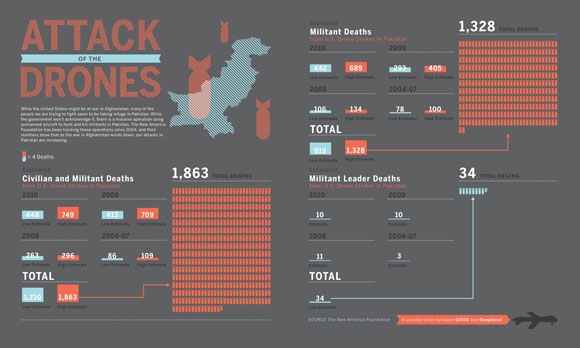
Attack of the Drones
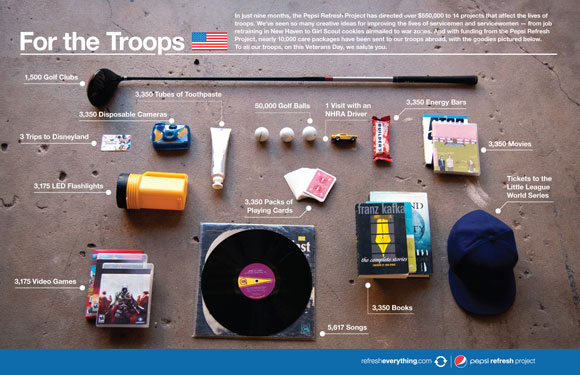
For the Troops
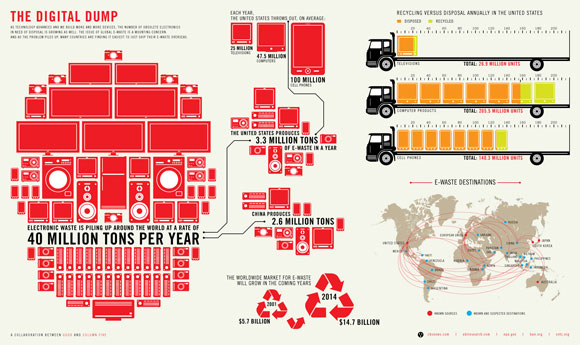
The Digital Dump
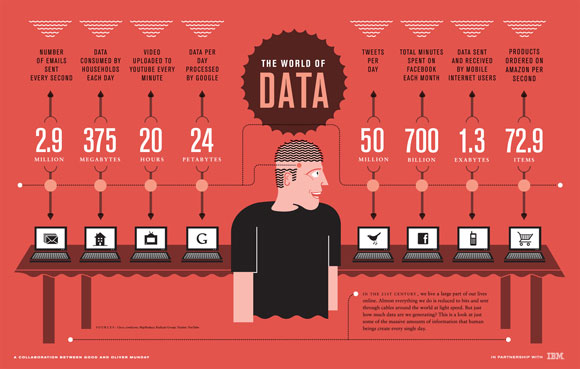
The World of Data
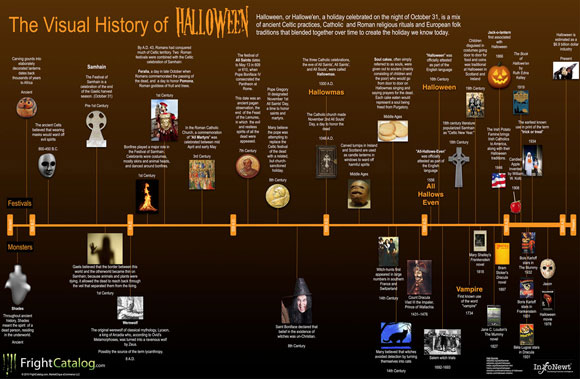
The Visual History of Halloween
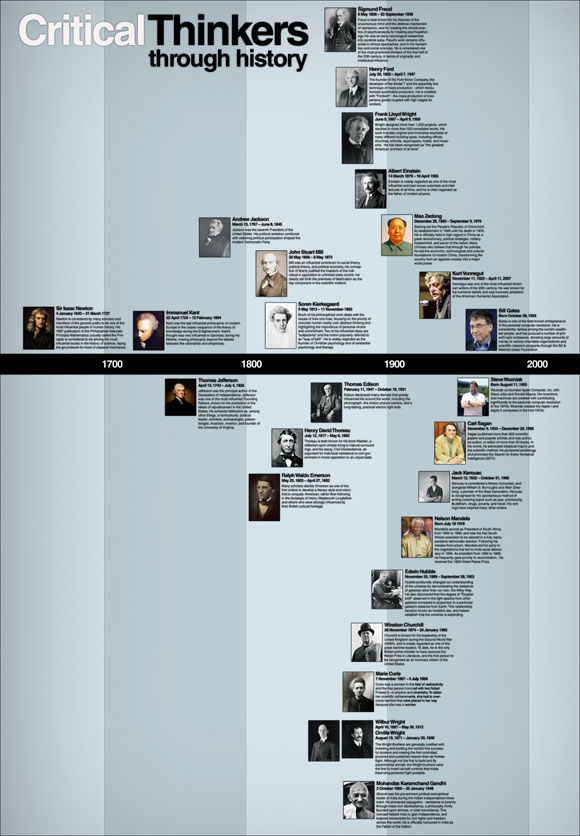
Critical Thinkers Through History
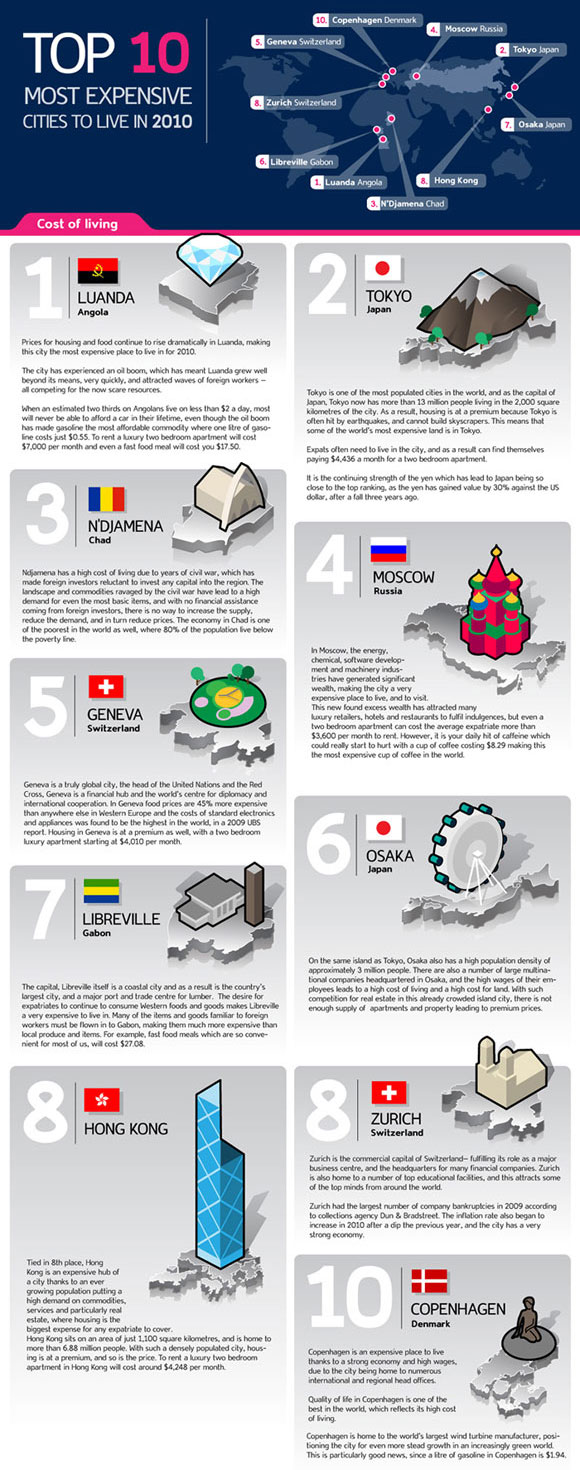
Top 10 Most Expensive Cities to Live In 2010
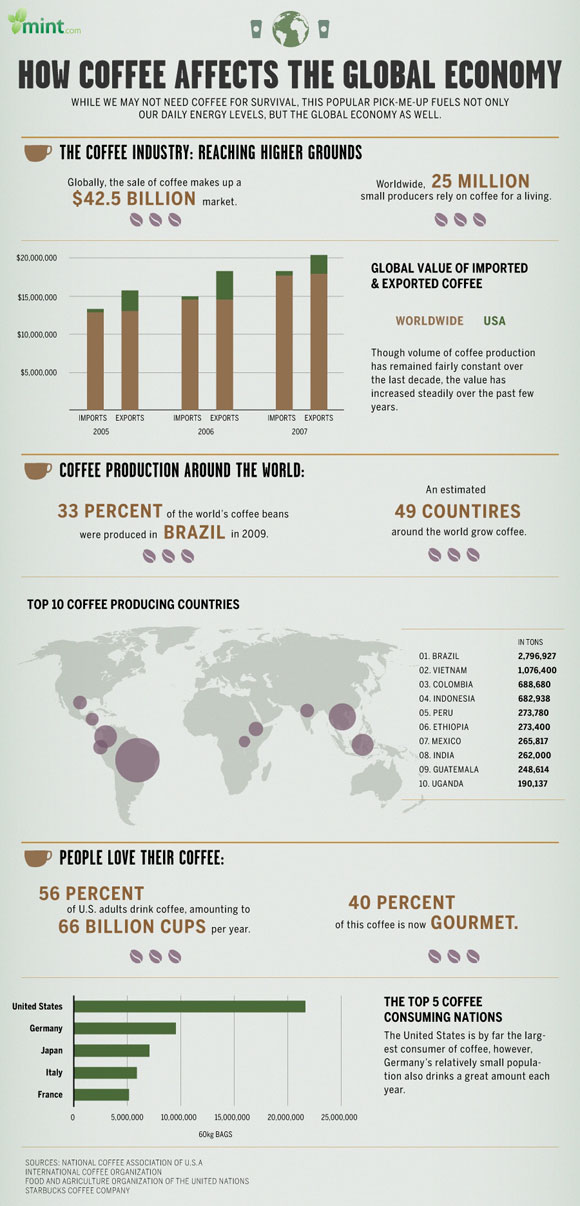
How Coffee Affects the Global Economy
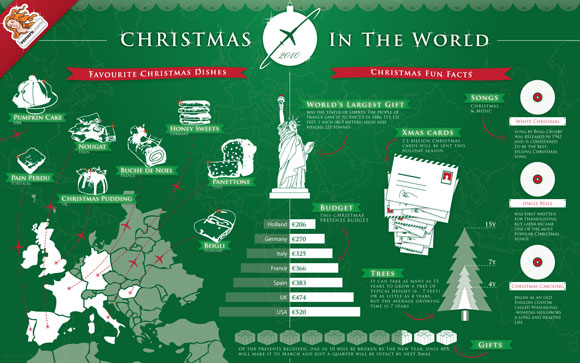
Christmas in the World
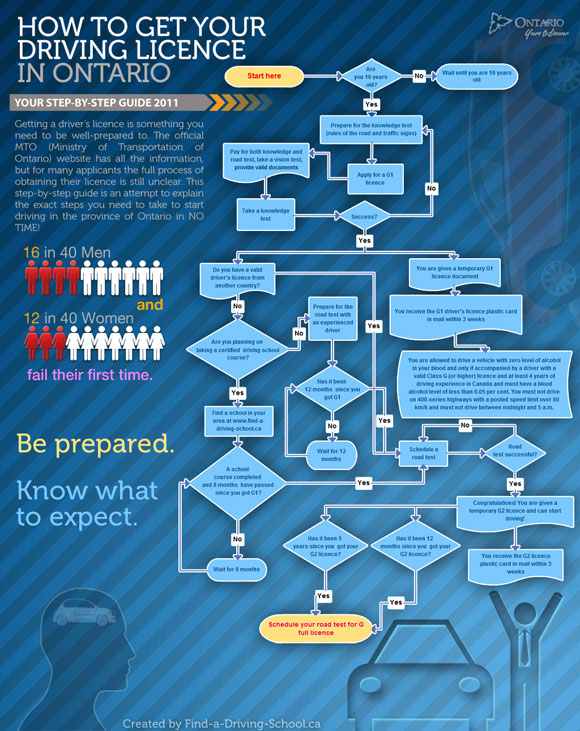
How to Get Your Driving Licence in Ontario


Too bad the “critical thinkers” is not readable, what a waste of effort.
This is because it is too big, you can click on te image title to visit the large version. Thanks alot!!
This is great those can’t waste time for reading.its helps me great.
Heya i’m for the first time here. I found this board and I to find It really helpful & it helped me out a lot. I hope to give something back and aid others like you helped me.